Dashboard and brokers
Dashboard
The Dashboard is the first page after you connect. It shows your cluster's name, broker count and controller, along with your topics and partition health: online, under-replicated and out-of-sync replicas.
Brokers
Brokers lists every broker in the cluster. Select one to see its details and configuration. You can edit settings where Kafka allows it.
Metrics
Broker and topic pages have metrics with headline numbers, trends, and every series grouped and searchable.
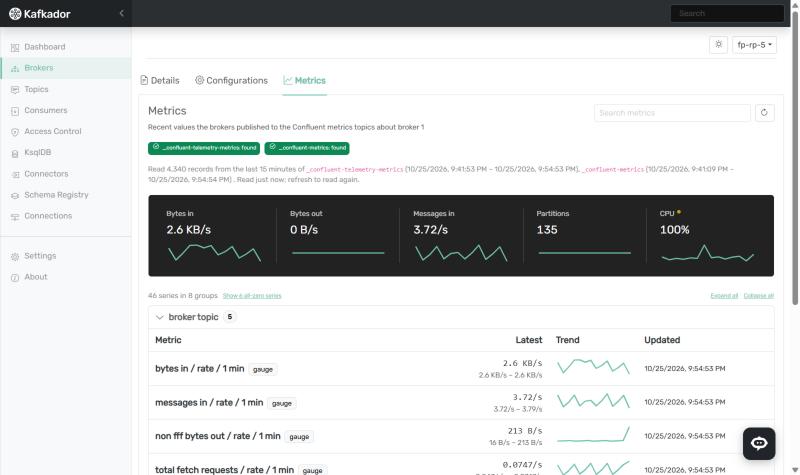
Kafkador reads these from the Confluent metrics topics, _confluent-telemetry-metrics and _confluent-metrics. If
neither has data, the page says that broker metrics aren't published to this cluster, and the rest of Kafkador works
as normal.
Tables and export
Many tables have search and sorting, and an Export menu that downloads CSV, JSON or XML.